
Report
Backtests you can read yourself.
MT5 screenshots first — then full HTML Strategy Tester reports for InfinityEA and InfinityEA X.
MT5 backtest screenshots
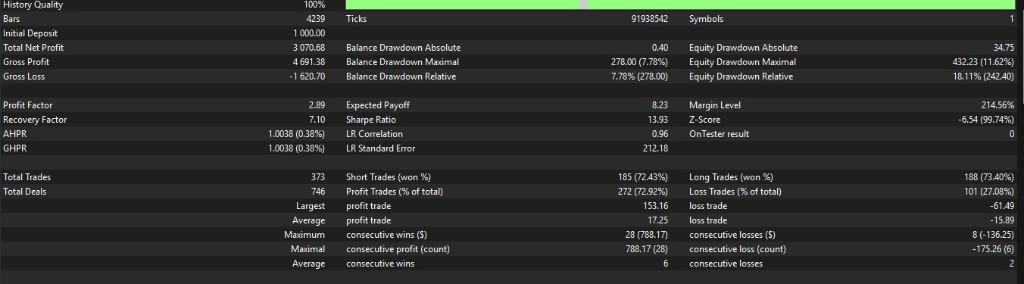
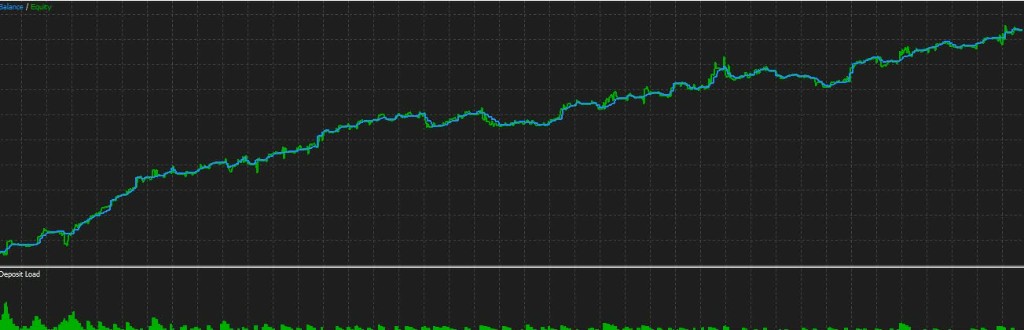
Real Strategy Tester stills. Tap any image to open full size and read the numbers yourself.
Tester start
Net profit
Profit factor
Max equity DD
 Open full size →
 Open full size →
On-chart dashboard panels
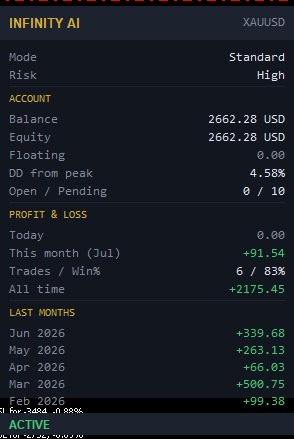
Three account snapshots from the InfinityEA panel on XAUUSD. Same book, different months.
 Open full size →
 Open full size →
 Open full size →
Screenshots are Strategy Tester / panel samples — not a live promise. Gold can lose. Read the HTML reports below for the full metric grid.
HTML Strategy Tester
Pick an EA. Same figures as the MT5 export.
Tester start
InfinityEA X sampleTester net profit
365 XAUUSD tradesProfit factor
MT5 Strategy TesterMax equity DD
365 XAUUSD tradesStrategy Tester Report
InfinityEA X
XAUUSD
FOMC_Filter=false
NFP_Filter=true
Show_Dashboard=true
| Company: | XS Fintech Ltd | Currency: | USD |
| Initial Deposit: | 10 000.00 | Leverage: | 1:100 |
Results
| History Quality: | 100% | Ticks: | 966003 | Symbols: | 1 |
| Bars: | 4034 | Balance Drawdown Absolute: | 130.39 | Equity Drawdown Absolute: | 139.87 |
| Total Net Profit: | 10 524.11 | Balance Drawdown Maximal: | 1 723.28 (9.20%) | Equity Drawdown Maximal: | 2 841.71 (14.35%) |
| Gross Profit: | 17 674.94 | Balance Drawdown Relative: | 9.20% (1 723.28) | Equity Drawdown Relative: | 14.35% (2 841.71) |
| Gross Loss: | -7 150.83 | ||||
| Profit Factor: | 2.47 | Expected Payoff: | 28.83 | Margin Level: | 649.84% |
| Recovery Factor: | 3.70 | Sharpe Ratio: | 13.01 | Z-Score: | -10.26 (99.74%) |
| AHPR: | 1.0020 (0.20%) | LR Correlation: | 0.97 | OnTester result: | 0 |
| GHPR: | 1.0020 (0.20%) | LR Standard Error: | 611.28 | ||
| Total Trades: | 365 | Short Trades (won %): | 175 (73.71%) | Long Trades (won %): | 190 (82.63%) |
| Total Deals: | 730 | Profit Trades (% of total): | 286 (78.36%) | Loss Trades (% of total): | 79 (21.64%) |
| Largest profit trade: | 880.11 | Largest loss trade: | -327.04 | ||
| Average profit trade: | 61.80 | Average loss trade: | -90.52 | ||
| Maximum consecutive wins ($): | 27 (1 666.54) | Maximum consecutive losses ($): | 8 (-130.39) | ||
| Maximal consecutive profit (count): | 2 426.50 (16) | Maximal consecutive loss (count): | -867.23 (4) | ||
| Average consecutive wins: | 10 | Average consecutive losses: | 3 | ||
Balance
Same figures as the MT5 tester. Open as a standalone HTML report. Sharpe on a short window can look extreme — read the 365 trades.
How to read it
InfinityEA X on a $10,000 tester start printed +$10,524.11 net, profit factor 2.47, max equity drawdown 14.35% ($2,841.71), 365 trades. Win rate was about 78%. Consecutive losses went to 8. Gold can gap through a stop.
Past performance is not indicative of future results. You can lose some or all of the $500 you put on the broker.